🕑 Reading Time: 0 Minutes
Our AI-Powered Tool To Rewrite For Readability
We built CopyFlow.AI for you to rewrite your website copy for scannability and readability using AI and our trained models.
🕑 Reading Time: 0 Minutes
🕑 Reading Time: 0 Minutes
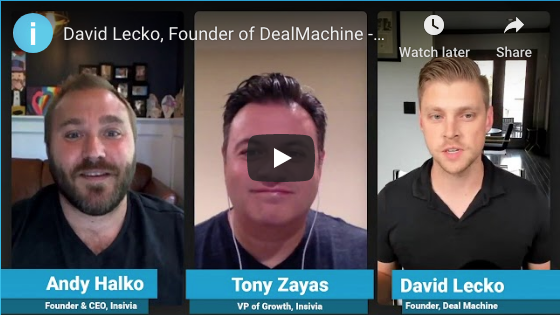
SaaS Founder Interview Show
Fascinating conversations with successful SaaS founders who share their journeys, learnings, and insights.
🕑 Reading Time: 0 Minutes