 Brand
Brand Product
 Experience
 Acquisition
Data visualizations are powerful tools for communicating complex information in a clear and concise manner. They allow us to present data in an easily understood way, regardless of the viewer’s level of expertise. Whether it’s communicating information internally to team members or externally to stakeholders and customers, data visualizations are crucial for effectively conveying information and insights.
Why is Data Visualization Imperative for your Team?
Internally, data visualizations help teams to understand and analyze data quickly and efficiently. By presenting data in a visual format, it is easier to identify patterns, trends, and outliers. This is particularly important for data-heavy industries such as finance, healthcare, and marketing, where large amounts of data need to be analyzed on a regular basis. With data visualizations, team members can quickly grasp the key insights and make informed decisions.
Digestible data visualizations can help to communicate complex information in a way that is more engaging and memorable than text-based reports or spreadsheets. Humans are visual creatures, and we are wired to process information more easily when it is presented in a visual format. By using charts, graphs, and other visual elements, we can make data more accessible and easier to remember. This is particularly important for teams that are working on complex projects or trying to communicate technical information to non-experts.
How Does Data Visualization Benefit External Communications?
Externally, data visualizations are crucial for communicating information to stakeholders, customers, and the public. Whether it’s presenting financial data to investors, sharing performance metrics with customers, or communicating public health information to the community, data visualizations are an essential tool for getting the message across. By presenting data in a visual format, we can make it easier for people to understand and act on the information.
For example, during the COVID-19 pandemic, data visualizations played a critical role in communicating public health information to the public. Charts and graphs showing the number of cases, hospitalizations, and deaths helped people to understand the severity of the situation and the importance of taking precautions such as wearing masks and social distancing. Similarly, data visualizations are used by companies to present product data to customers, such as sales trends or customer satisfaction ratings. By presenting this data in a visual format, companies can help customers make informed decisions about their purchases.
Data visualizations are important for building trust and credibility with stakeholders. When we present data in a visual format, we are able to provide evidence to support our claims and assertions. This can be particularly important in industries such as finance or healthcare, where decisions based on inaccurate data can have serious consequences. By using data visualizations to present information in a clear and transparent manner, we can build trust and credibility with stakeholders, and ensure that decisions are based on accurate and reliable data.
Using GA4 for Important SaaS Metrics
The newest update to Google Analytics, GA4, has brought a wave of exciting new features that SaaS companies simply cannot afford to ignore. With GA4, businesses can now track user behavior across multiple platforms and devices, providing a more comprehensive view of customer engagement.
One of the most innovative features of GA4 is the ability to track events and user behavior in real-time. This means that SaaS companies can now analyze user behavior as it happens, allowing them to quickly respond to changing customer needs and optimize their user experience in real-time.
Another exciting feature of GA4 is the integration with Google Ads, which allows SaaS companies to measure the effectiveness of their ad campaigns more accurately. This integration enables businesses to track how users interact with their ads, from the initial click all the way through to conversion, giving them valuable insights into the customer journey.
SaaS companies also need to take advantage of GA4’s enhanced data privacy features. With stricter data privacy regulations coming into effect, such as GDPR and CCPA, businesses need to ensure that they are collecting and processing user data in compliance with these regulations. GA4’s advanced privacy controls enable businesses to anonymize user data and control how their data is used, ensuring that they are in compliance with these regulations.
In addition to these features, GA4 also provides businesses with advanced predictive analytics capabilities. This means that SaaS companies can now use machine learning algorithms to analyze user behavior and predict which customers are most likely to convert, allowing them to tailor their marketing efforts more effectively.
Key Data and Visualizations for SaaS Companies
Data visualization is essential for monitoring key metrics and making informed, strategic decisions. SaaS businesses operate in a dynamic environment, where customer behavior and market trends can change rapidly. By visualizing critical data, SaaS companies can quickly identify trends, spot anomalies, and make data-driven decisions that can help to grow their business. Here are some of the most important data to visualize for SaaS companies:
Customer Acquisition and Retention Metrics
SaaS companies need to track customer acquisition and retention metrics such as customer lifetime value (CLV), churn rate, and customer acquisition cost (CAC). By visualizing these metrics, SaaS companies can quickly identify areas where they need to improve to retain more customers and acquire new ones.
Sales Metrics
SaaS companies need to track sales metrics such as monthly recurring revenue (MRR), annual recurring revenue (ARR), and average revenue per user (ARPU). By visualizing these metrics, SaaS companies can identify trends in sales and make informed decisions about pricing, sales strategies, and customer targeting.
User Engagement Metrics
SaaS companies need to track user engagement metrics such as active users, user retention rate, and feature usage. By visualizing these metrics, SaaS companies can identify which features are popular and which ones need improvement. This can help to drive user engagement, increase customer satisfaction, and reduce churn.
Support Metrics
SaaS companies need to track support metrics such as response time, resolution time, and customer satisfaction (CSAT) scores. By visualizing these metrics, SaaS companies can identify areas where they need to improve their support processes and provide better customer service.
Product Performance Metrics
SaaS companies need to track product performance metrics such as uptime, load time, and error rates. By visualizing these metrics, SaaS companies can quickly identify any issues with their product and take corrective action before they impact customers.
Financial Metrics
SaaS companies need to track financial metrics such as cash flow, profit margins, and burn rate. By visualizing these metrics, SaaS companies can monitor their financial health and make informed decisions about funding, pricing, and growth strategies.
Marketing Metrics
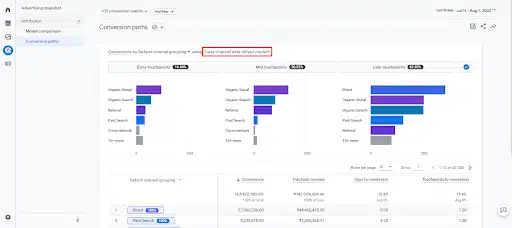
SaaS companies need to track marketing metrics such as website traffic, conversion rates, and customer acquisition cost (CAC). By visualizing these metrics, SaaS companies can identify which marketing channels are most effective and optimize their marketing campaigns for better results.
Key Takeaways
Data visualizations are crucial for communicating information both internally and externally. They help teams to analyze and understand data quickly and efficiently, and make it easier to communicate complex information to non-experts. Data visualizations are also important for building trust and credibility with stakeholders, and for making informed decisions based on accurate and reliable data. As such, data visualizations should be a key tool in any organization’s toolkit for effective communication.
SaaS companies need to visualize a wide range of data to make informed decisions and grow their business. By tracking critical metrics such as customer acquisition and retention, sales, user engagement, support, product performance, financials, and marketing, SaaS companies can quickly identify trends, spot anomalies, and make data-driven decisions that can help to grow their business.

Written by: Tony Zayas, Chief Revenue Officer
In my role as Chief Revenue Officer at Insivia, I am at the forefront of driving transformation and results for SaaS and technology companies. I lead strategic marketing and business development initiatives, helping businesses overcome plateaus and achieve significant growth. My journey has led me to collaborate with leading businesses and apply my knowledge to revolutionize industries.