The Ultimate Guide to Dashboards
From the topic, you are probably asking yourself:
- What are dashboards?
- What is the importance of dashboards?
- How do you design dashboards?
SaaS businesses adopted the term “Dashboards” from the automotive industry. The use of the word is similar in both sectors. Like your car, your organization is a complex system with hundreds of processes. Each piece has an impact on the overall performance of the business. The dashboard in your car summarizes all the processes that take place in your vehicle. The dashboard summarizes all the events that are happening in the background. With real-time data and visuals, simplifies everything for your understanding.
To make visuals possible, the dashboard extracts data from key performance indicators (KPIs). A dashboard is a hub for software users that grants access to vital information on the software. A dashboard is a tool that analyzes and tracks key data metrics.
A dashboard is an information management tool. It tracks and manages metrics, KPIs, and other data points relevant to your business. Through data visualization, dashboards simplify complex sets of data.
What is the importance of dashboards? At a glance, you can deduce some facts about the performance of a business. When you use them properly, dashboards can help you make informed decisions. In this way, you can improve the performance of your business and, ultimately, your bottom line.
The Business Application of Dashboards
The importance of dashboards is in the significant impacts that they may have on the performance of your business. Dashboards can keep everyone in your organization on the same page. You can align different departments and inspire them to work toward the same goal.
Features and the Importance of Dashboards
Ever wondered what you should include on your dashboard? Dashboards share specific features at the most basic level. These features may have an impact on your dashboard project. Below are some of the features that dashboards have: Data visualization plays a role in the importance of dashboards. Choosing appropriate data visualization tools is an essential part of Dashboard Design. Data visualization is the concept of using graphical representation to simplify the transmission of complex information. It is easier for an end-user to identify trends in charts than interpret hundreds of figures. Below are some popular data visualization tools:
- Tables: Organize data into rows and columns. Tables may also contain other visual elements like sparklines and bullet charts.
- Line Charts: Plot values on charts to show trends over time. Multiple line charts depict comparison.
- Bar Charts: Plot values on charts to show comparisons within the same category. Stacking bar charts show how similar data sets relate to each other.
- Gauges: Depictprogress towards an objective. The use of color in gauges indicate the target achievement or non-achievement.
Ever wondered what you should consider to include in your dashboard? The appropriate dashboard features depend on the end-user. What are they looking for, and what information do they want to access? Some of the most basic features of dashboards that are typically on them include graphs and charts, metrics, icons, images, statistics, alerts, tabs and organizers, and qualitative and quantitative data.
Types of Dashboards
Before we can address the importance of dashboards, you need to understand the different types of dashboards available. Dashboards fall under three main categories:
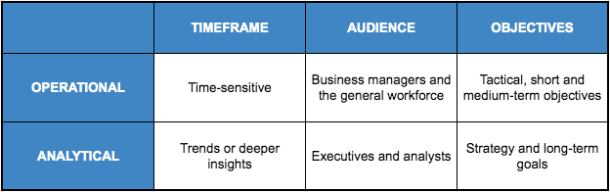
- Operational Dashboards: The most common dashboards fall under this category. Operational Dashboards have their metrics updating in real-time and showing data that relates to daily operations. Operational dashboards provide a snapshot of your software’s performance.
- Analytical Dashboards: These dashboards provide users with the data they need to make decisions. Analytical dashboards incorporate a lot of drilldowns and pivot tables. Analytical dashboards are valuable to analysts. Why? The information in these dashboards are technical and require a deeper level of understanding.
- Strategic Dashboards: These dashboards track performance in relation to your KPIs. You want to share this type of dashboard with everyone in your organization with everyone in your organization. Data transparency can increase motivation.
Below is a table that shows how analytical and operational dashboards compare:
The Importance of Dashboards
The effective use of dashboards can have a significant effect on the performance of your business. Dashboards can keep everyone in the loop. Below is a breakdown of the importance of dashboards.
#1: Value for Data
Data is one of the most valuable assets in possession of most businesses. The challenge is putting the data to use. Effective dashboard design should provide access to core business metrics while informing all users in your organization. Everyone in your organization should be able to use the dashboard to run your business better. Dashboards give you more value out of your data.
#2: Data Consolidation and Automation
Dashboards gather information from multiple sources and present them in a single reporting interface. This nature of dashboards reduces the time and effort that you need to compile a report. With dashboards, you can expose the metrics of your business to a wider audience. Dashboards allow you to consolidate and automate multiple data points.
#3: Departmental Alignment
Data does not lie. Dashboards support inter-departmental collaboration. People from different departments can view the metrics and performance data of your business. With the information, the departments can adjust their tactics. For example, sales and marketing teams can align their goals toward customer acquisition. From the same dashboard, each department can find the metrics that are relevant to them. Dashboards help in departmental alignment.
#4: Data Access and Transparency
Data is your organization’s most valuable commodity. None of this means anything when you cannot access or translate the data. Dashboards are effective in these functions. From the dashboard, you can see an overview of your business in one glance.
#5: Decision Making
The insight that you gain from dashboards is accurate and unbiased. Dashboards can offer a great foundation for decision making at both the departmental and executive levels.
#6: Accountability
Dashboards highlight everything that is going right and wrong for your company. You can get a sense of the things that are not working for your company. You can also hold different departments accountable for both the ups and downs.
More content on the importance of dashboards:
- The importance of dashboards
- What is the importance of dashboards?
- The importance of dashboards to your business
Building and Designing Dashboards
Now that you know about the importance of dashboards, how do you design them? The ideal dashboard should promote action while changing behavior. Before you can build a dashboard, you need to establish a plan of action. Below are a few tips on the path to successful dashboard design:
1. Define Your Audience
Any dashboard project starts and ends with your audience. What is the importance of dashboards to your audience? You need to establish who uses your dashboard and how these users intend to use the tool. Your audience will determine whether you are building a tool for consumption on mobile devices or the cloud.
2. Identify the Metrics to Measure
The importance of dashboards is the fact that they track key metrics. What problem are you trying to solve? The type of dashboard you create depends on the metrics and KPIs that you intend to track. Identifying these variables at the initial stages of your project will help you understand what you are trying to accomplish.
3. User Context
How will you enjoy the importance of dashboards if you cannot communicate with the user? In what context will the user view your dashboard. You know your audience; in this step, you will select the visuals that are meaningful to these users. For CEOs, you want to create a compact dashboard with simple and clean visuals. For the Analyst, you want a dashboard that dives a little deeper into data. You might want to consider sophisticated visuals for this demographic.
4. Design for Immediate Action
The value of a dashboard depends on how well it presents the current status of critical metrics. The dashboard should prompt a response from its users. Success comes when you establish and stick to one consistent design convention. To avoid confusing users, always choose from a smaller color pool and use fewer symbols.
5. Test Evaluate, and Tweak
As your users interact with the dashboard, they will have inputs in relation to use and effectiveness. With user feedback, you can tweak your dashboard to become as effective as possible. In this way, you can also reduce customer churn. Collect feedback from your users and make adjustments to your dashboard.
Dashboard Examples
You know what dashboards are, and you understand the importance of dashboards. Now it’s time to look at some examples. You can present your dashboard in three ways, as on-premise software, Cloud software, and Mobile software.
- On-Premise: This is where that software exists on your computer or network. You can manage your dashboards locally. You can easily publish the data via printing or export as PDFs.
- Cloud: You can access the software via any computer with an internet connection. The dashboards and browser-friendly, and you can publish your data across many devices.
- Mobile: You can access the software on any mobile device. The dashboard may be an app, or it may come from a cloud environment.
Above are examples of data dashboards presented across different platforms. As you can notice, instead of boring figures, you have pleasant visuals that communicate performance. You can see line charts that show trends and bar graphs that depict comparisons.
What’s the Importance of Dashboards
Every organization can benefit from installing dashboards that align with its goals. Dashboards provide your organization with an insight into the software that you use. This tool simplifies data and evokes action. You can also use dashboards to align different departments to work towards the same goal.
Dashboards track key metrics that may help you improve your business. Are dashboards the right tool for your business? At Insivia, we work with many SaaS companies to develop the perfect solutions for them. Consult with us, let us establish the right dashboard strategy for your organization.

Written by: Tony Zayas, Chief Revenue Officer
In my role as Chief Revenue Officer at Insivia, I help SaaS and technology companies break through growth ceilings by aligning their marketing, sales, and positioning around one central truth: buyers drive everything.
I lead our go-to-market strategy and revenue operations, working with founders and teams to sharpen their message, accelerate demand, and remove friction across the entire buyer journey.
With years of experience collaborating with fast-growth companies, I focus on turning deep buyer understanding into predictable, scalable revenue—because real growth happens when every motion reflects what the buyer actually needs, expects, and believes.